BMAP® Knee

BMAP® Knee Bioreactor
Bmap KNEE is the only commercial bioreactor in the world designed specifically for maturing knee cartilage tissue.
This patented bioreactor replicates the human knee’s physiological conditions with unique precision, providing advanced mechanical stimulation and a fully controlled, bioactive environment for tissue maturation.

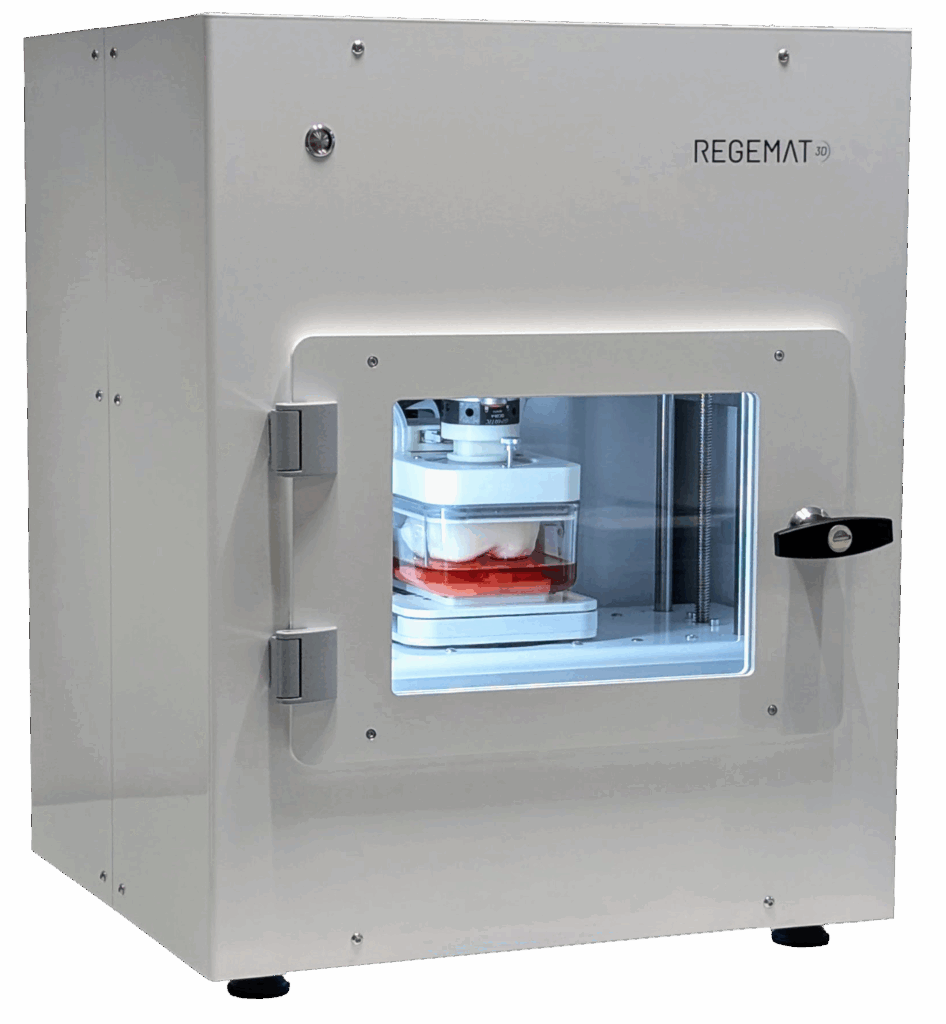
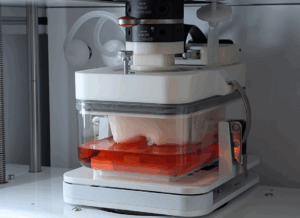
Physiologically Relevant Microenvironment
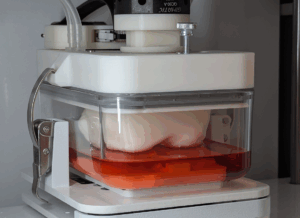
BMAP® Knee replicates the anatomical and biomechanical conditions of the knee joint, enhancing the functional maturation of biofabricated cartilage constructs.

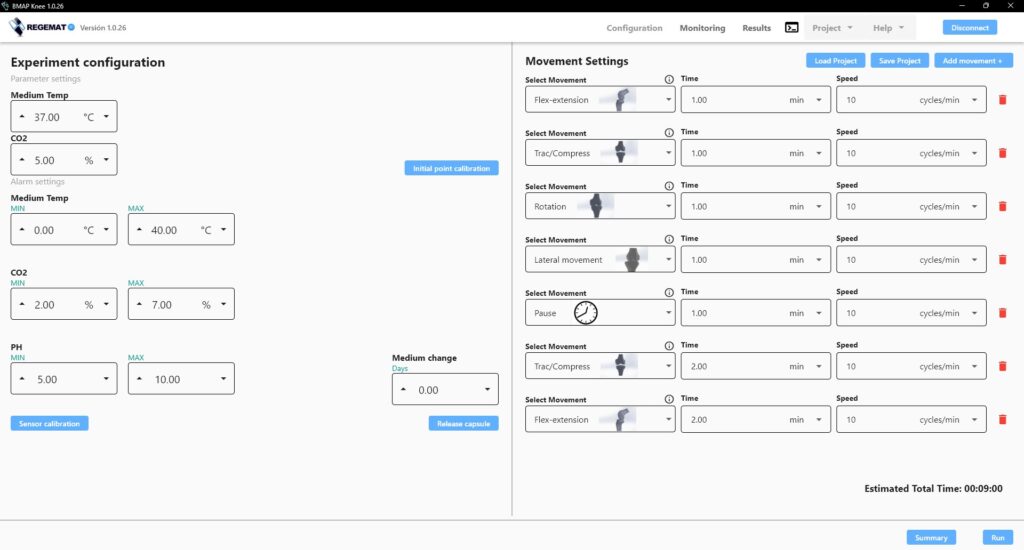
Advanced Mechanical Stimulation
BMAP® Knee offers precise control over compression, flexion-extension, rotation and lateral displacement, simulating real joint motion to improve tissue organization and extracellular matrix deposition.

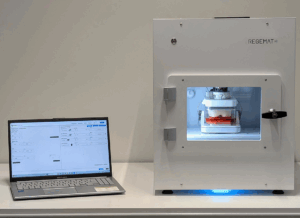
Customizable Experimental Parameters
Users can define movement patterns, frequency and duration, tailoring the mechanical conditioning to specific research needs.

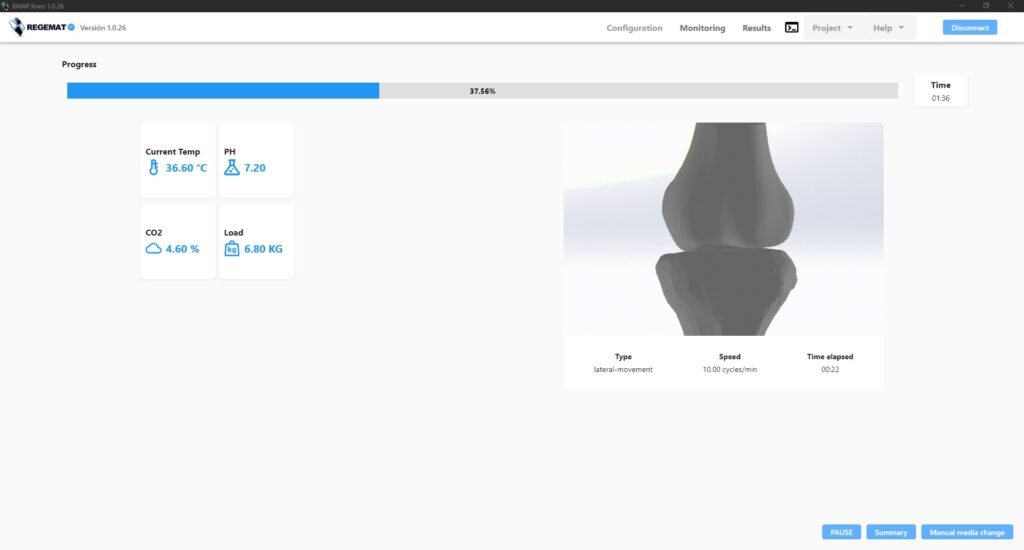
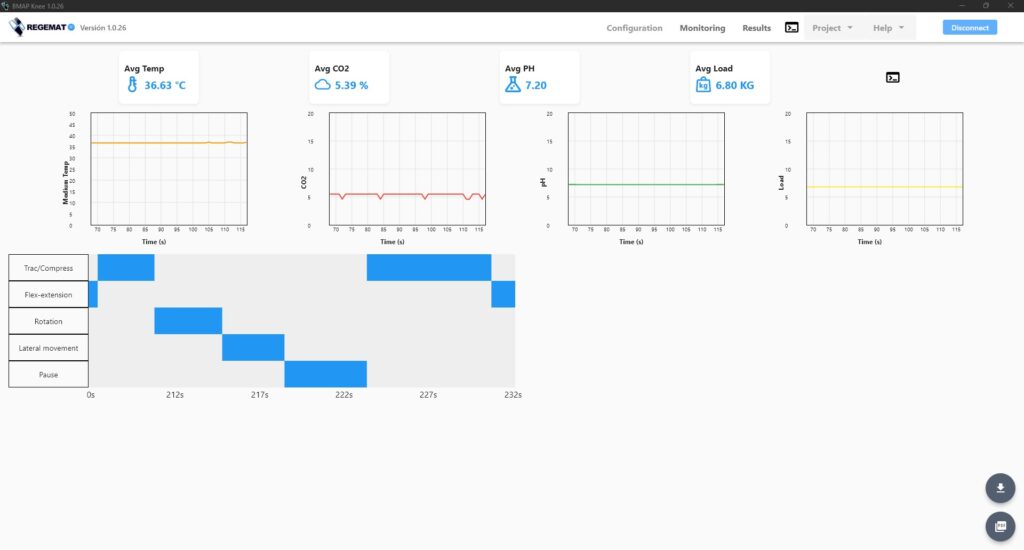
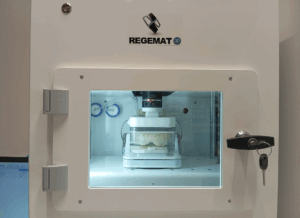
Real-Time Environmental Monitoring
Integrated sensors track and regulate critical parameters such as CO₂ concentration, temperature and pH, ensuring optimal cell culture conditions.

Personalized Tissue Engineering
BMAP® Knee supports patient-specific constructs by integrating CT/MRI data to create anatomically accurate cartilage scaffolds for regenerative medicine applications.
Software BMAP® Knee
01

Experiment Configuration
Medium Temperature: Set and maintain the ideal temperature for optimal cell development.
CO₂ Concentration: Regulate carbon dioxide levels — a key factor in many biological processes.
You can also set up smart visual alerts for parameters like temperature, CO₂, and pH. If any value goes out of range, you’ll receive an instant notification, so you can take quick action and protect your experiment.
02

Motion Programming
Live Sensor Readings: View real-time values for temperature, CO₂, pH, and other key parameters.
Current Motion Details: See which movement is being executed, along with its duration and speed.
Routine History: Access a complete log of the executed protocol steps.
Sensor Averages: Review average values for each parameter during the experiment.
Visual Graph: Analyze the biocapsule’s behavior over time through an intuitive chart.
04

Results
During or after the experiment, the Results tab provides:
A complete log of the routine
Average sensor values
A graph showing the behavior of the biocapsule over time